
Originally published on Twitter on August 16, 2020
Read on to learn why each indicator matters and how to evaluate the strength of each one.
1. Total Value Locked / Fully-Diluted Market Cap
Here’s why: Protocols with more value locked should be able to capture more value.
Rule of thumb: ↑ number = better
DIY: DeFi Pulse & Coin Gecko
2. Price to Sales (aka Marketcap / Revenue)
Here’s why: DeFi protocols that sustainably capture revenue have better long-term prospects.
Rule of thumb: ↓ number = better
DIY: Token Terminal
3. % of Token Supply on Exchanges
Here’s why: Useful for understanding float dynamics (i.e. maximum sell pressure)
Rule of thumb: ↓ number = better
DIY: Nansen
4. User Growth (aka Unique Address Growth)
Here’s why: Useful indicator for determining product-market fit.
Rule of thumb: ↑ slope = better
DIY: Dune Analytics (start with this example dashboard)
5. Token Balance Change on Exchanges
Here’s why: When tokens move onto exchanges, there is a high likelihood of sell activity.
Rule of thumb: ↓ exchange balance = better
DIY: Nansen
6. Non-Speculative Usage
Here’s why: Looking at the number of daily transactions not related to speculation (trading) is a great way to understand how much a protocol is actually being used for its intended purpose.
Rule of thumb: ↑ number = better
DIY: no one-stop shop to view this yet!
7. Liquid Inflation Rate
Here’s why: investors should be aware of potential dilution and deeply understand a project’s token economic model
Rule of thumb: None – not all inflation is bad.
DIY: Messari Crypto
More Indicators
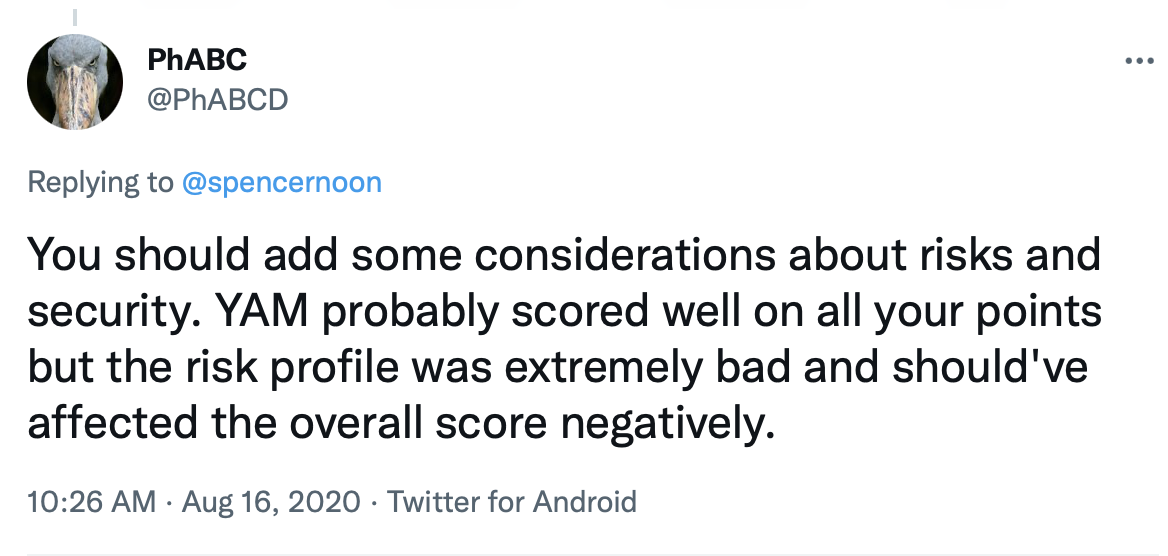
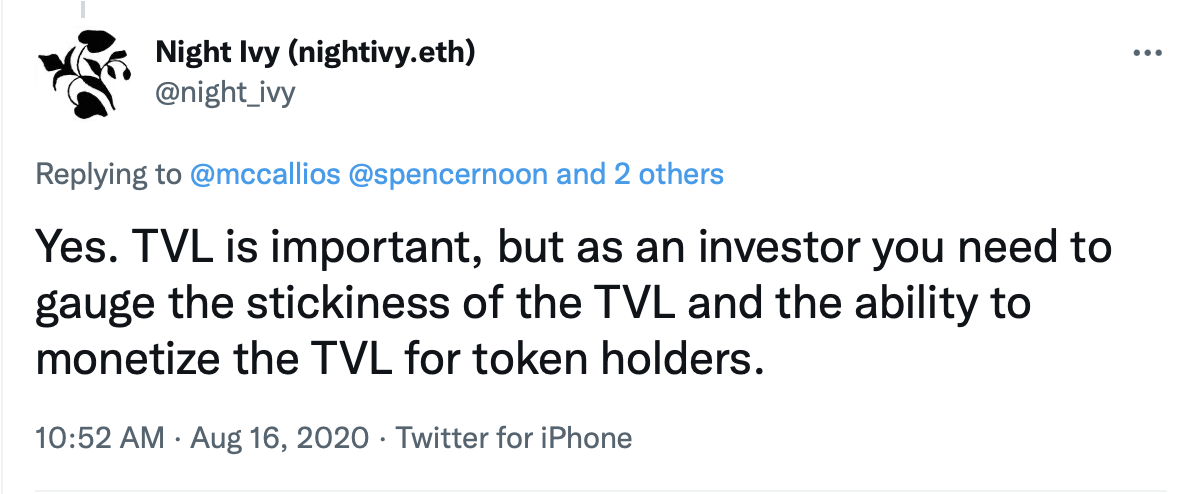
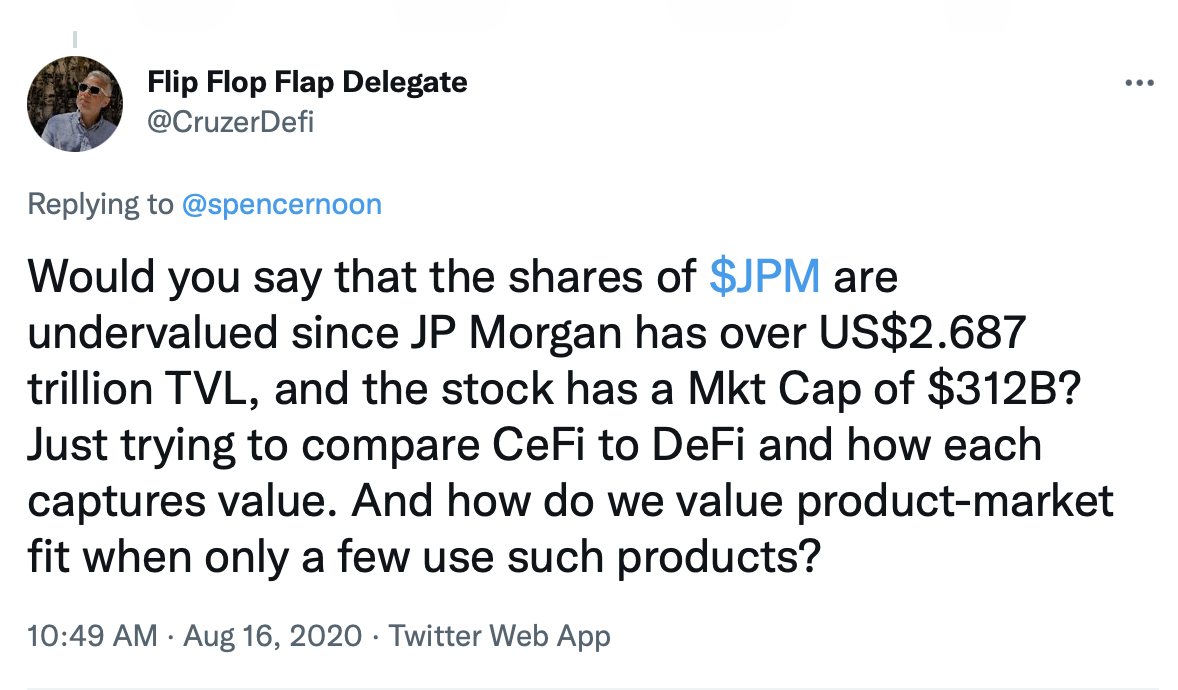
Here is some of the best additional feedback I’ve received about risks and other investment considerations.
A Grain of Salt
Finally, an important note: DeFi indicators are not one-size-fits-all. These indicators can be gamed (especially during bull markets).
If you want to learn more DeFi fundamentals, subscribe to my crypto analytics newsletter Our Network.